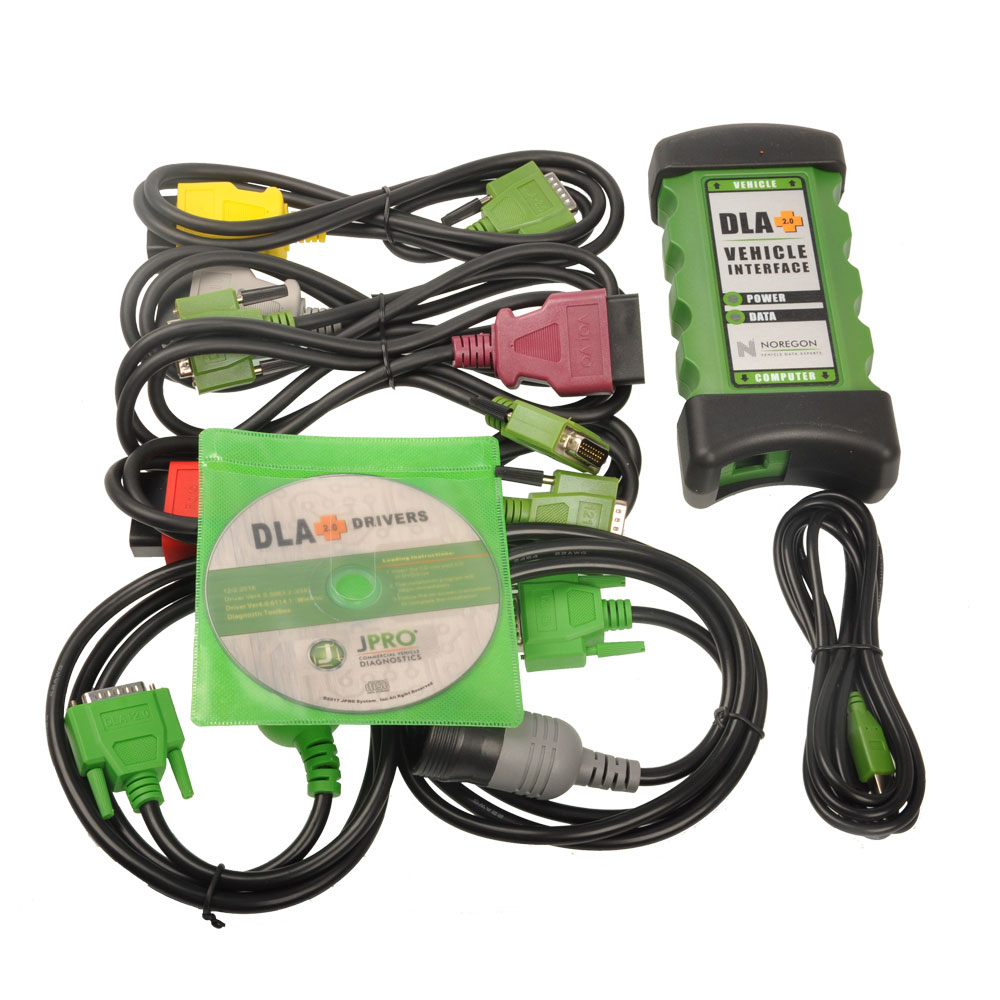
The JPRO Commercial Vehicle Graph Heavy Duty Data Function is a powerful tool that allows users to monitor and analyze various data items and parameters in a constantly updating graph format. This function is available in the 2023 JPRO Commercial Vehicle Diagnostics software and requires the Noregon JPRO DLA+ 2.0 Adapter Kit.
To utilize the Graph function, follow these simple steps:
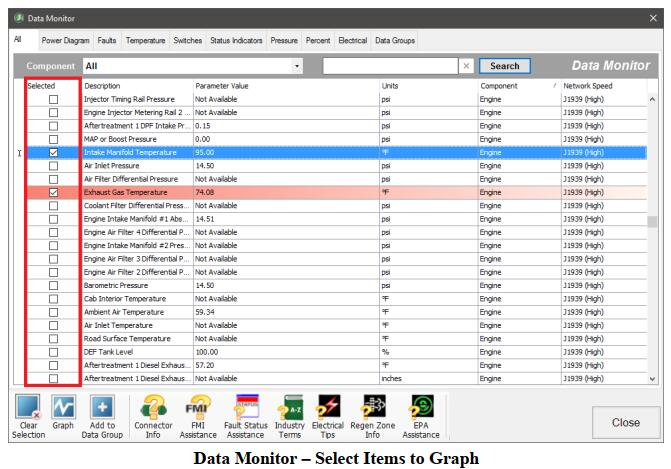
1. Start by selecting the data rows of interest in the Data Monitor. You can do this by clicking the Selected checkbox next to each desired data item. If you want to clear any previously selected rows, simply click the Clear Selection button.
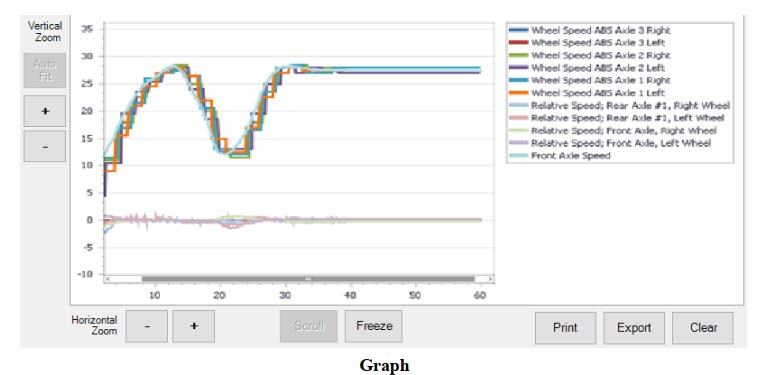
2. Once you have selected the desired data rows, click on the Graph button. This will launch the Graph window, where the selected data items will be plotted on the graph over time.
3. The Graph window provides several customization options to enhance your viewing experience. Hovering the cursor over the graph will display the value plotted at that specific point. You can also zoom in or out on each axis of the graph independently by clicking either the + or – button. Clicking the Auto Fit button will resize the graph to show all plotted data items. The Scroll button automatically moves the graph view to the most current information. The Freeze button allows you to keep the graph view from moving, enabling you to study the data while the graph continues to run.
4. If you wish to save or print the graph, the software provides options for that as well. The Print option allows you to print the current graph view, and it is recommended to use a color printer for optimal results. The Export option displays a save file dialog, where you can save up to the last 5 minutes of currently graphed data as an XML file to your desired location. Additionally, the Clear button removes all data from the graph and begins capturing new data.
In conclusion the JPRO Commercial Vehicle Graph Heavy Duty Data Function is a valuable feature that allows users to monitor and analyze data in a visually appealing and informative way. By utilizing this function, users can easily identify trends and patterns, aiding in diagnosing and troubleshooting commercial vehicles effectively.
Leave a Reply